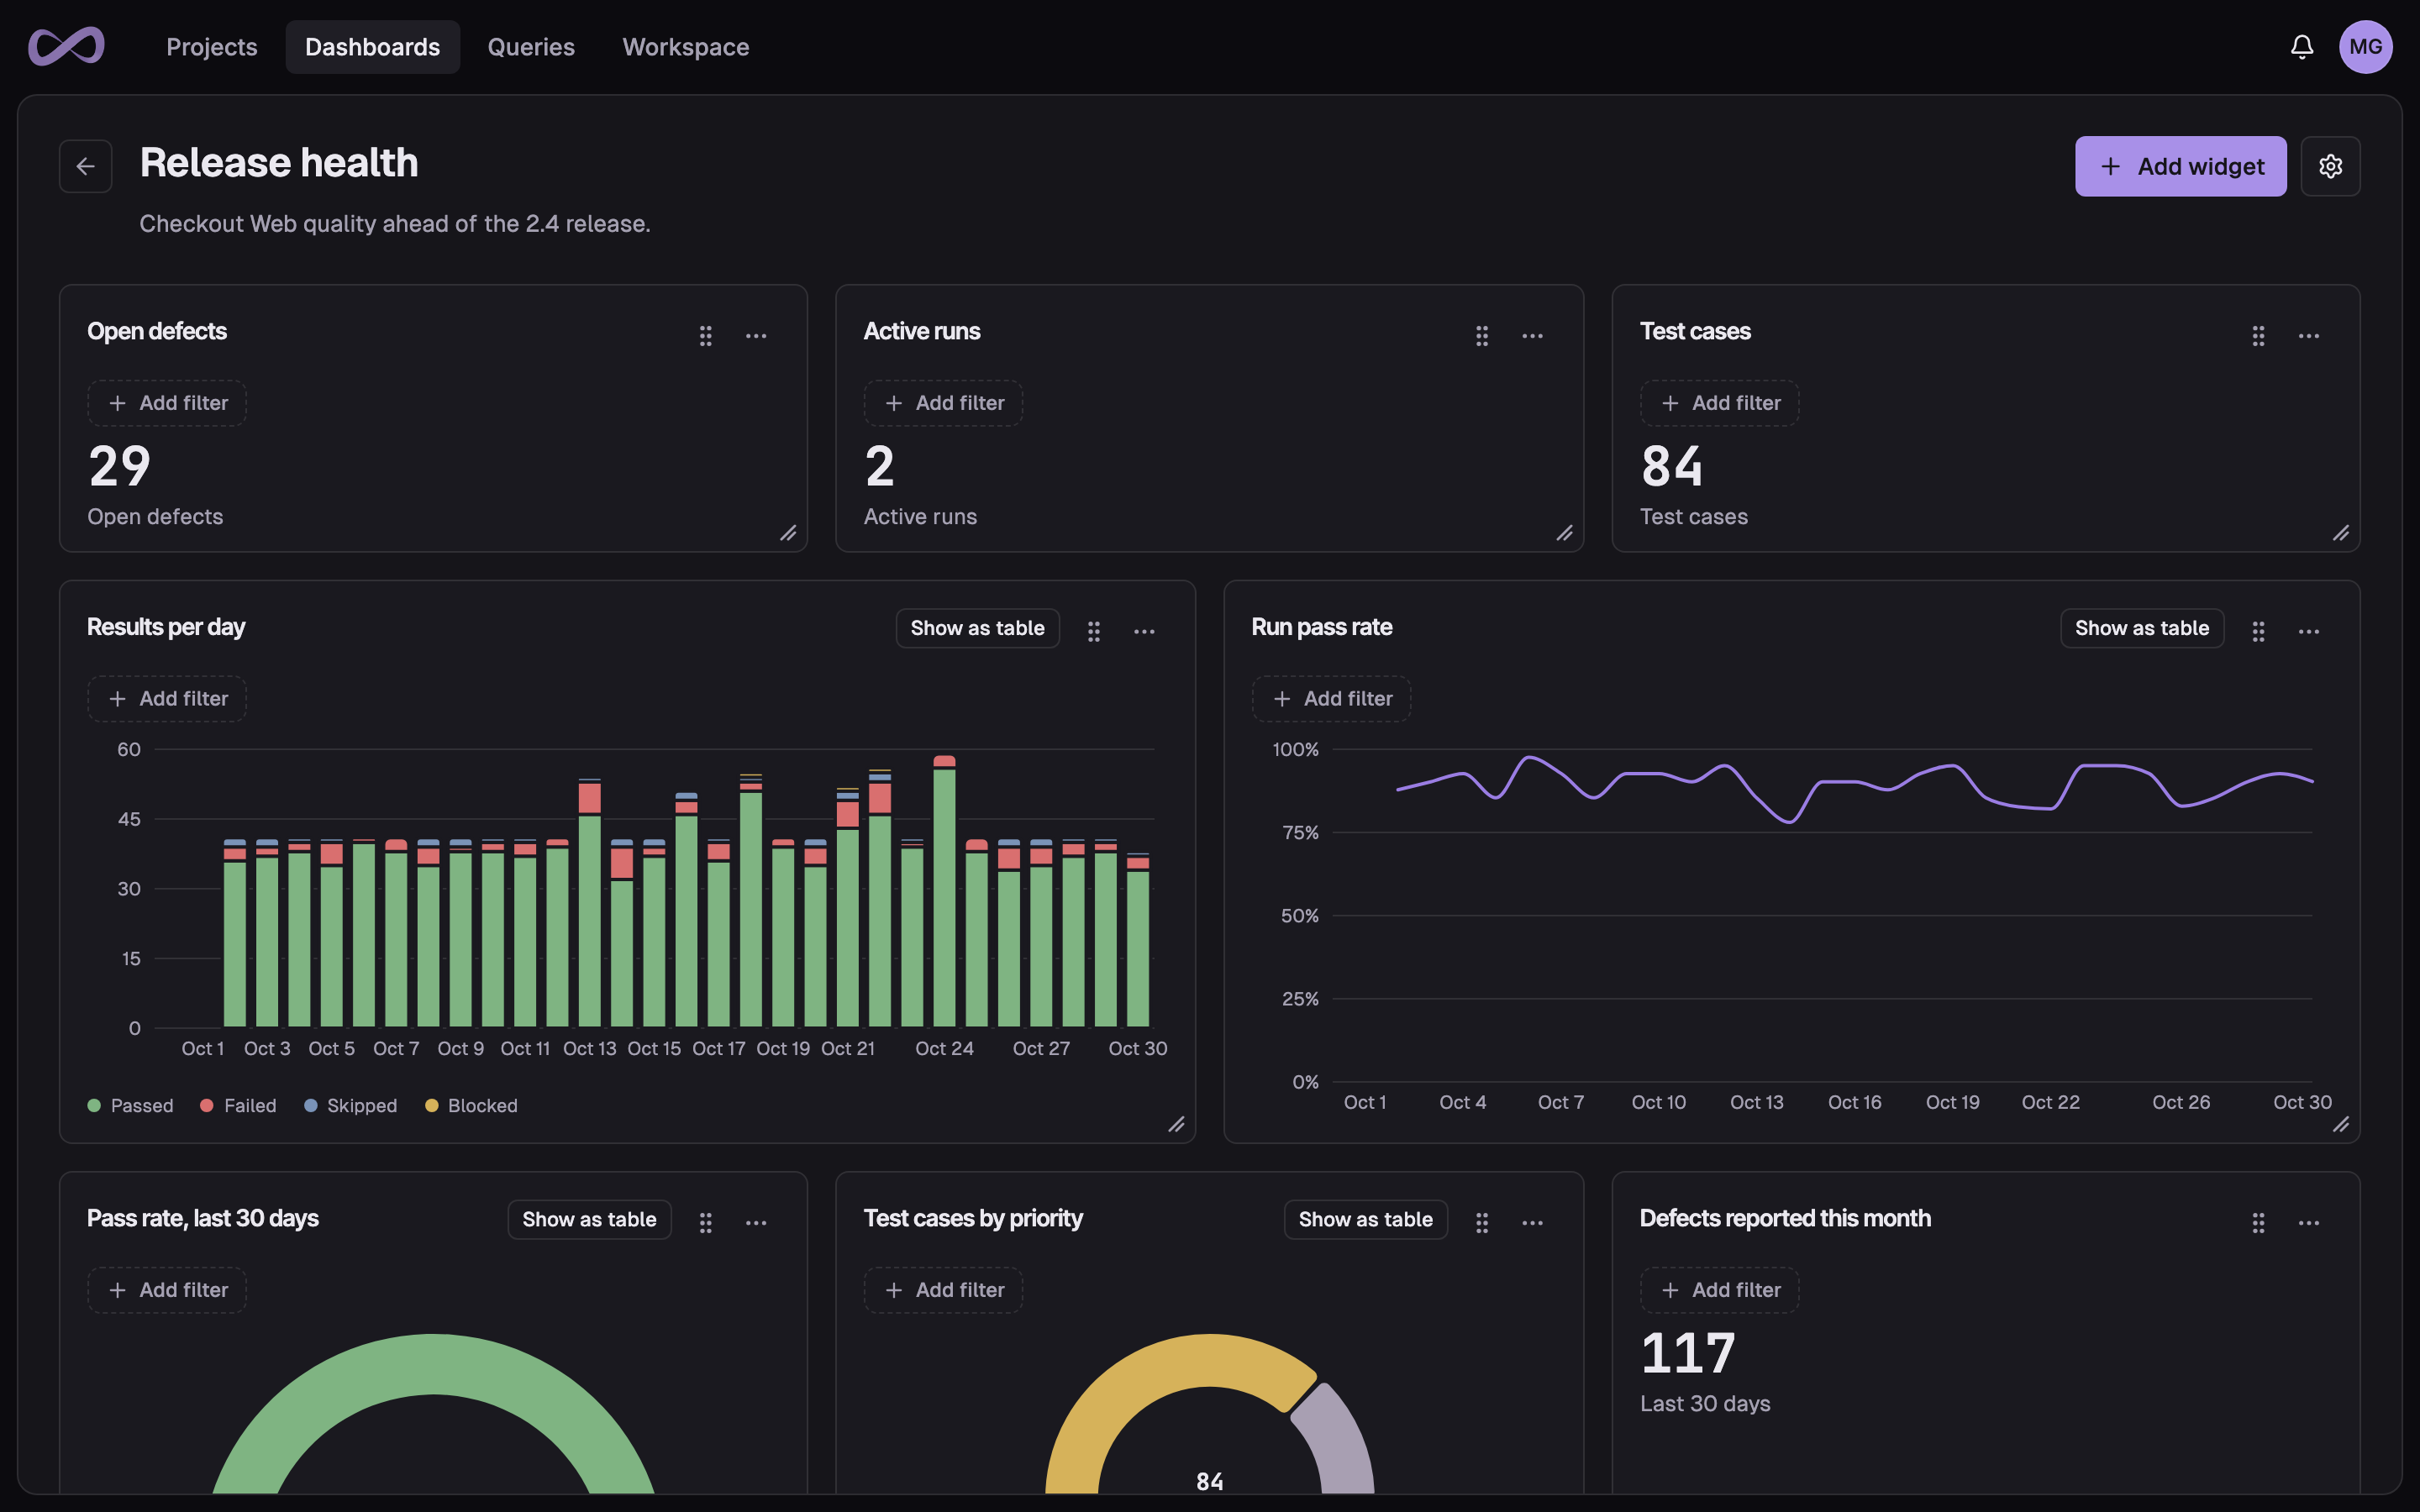
The Release health dashboard in Probara: open defects, active runs and test cases, then the last 30 days as results per day in bars stacked by status and the run pass rate as a line.

QA dashboards that answer the questions your team actually asks

Put pass rates, open defects and results by status on one shared dashboard. When a built-in chart is not enough, write the question in PQL and pin the answer next to the rest.

Dashboards, Queries and saved queries come with Pro, and with the 14-day Pro trial. The defect metrics on each project’s Defects page are on every plan, Free included. Compare plans

Widgets for the QA metrics you report on

A dashboard holds up to 50 widgets, from a single total to a time series over the last two years. Pass rate, results by status, open defects, run duration and test cases created and edited are all one widget away.

Each widget picks its own projects, period and filters, such as the open defects assigned to one person, and everyone who opens the dashboard sees the same setup.

Widget types
Single value
Open defects, active runs, flaky test cases
Created in a period
Test cases, defects, results or runs
Distribution
Test cases by any field, as a donut or bars
Time series
Bars, a line or a daily heatmap
Pass rate
A gauge, or a bar against your target
Query
The live results of a saved query

Every number opens the records behind it

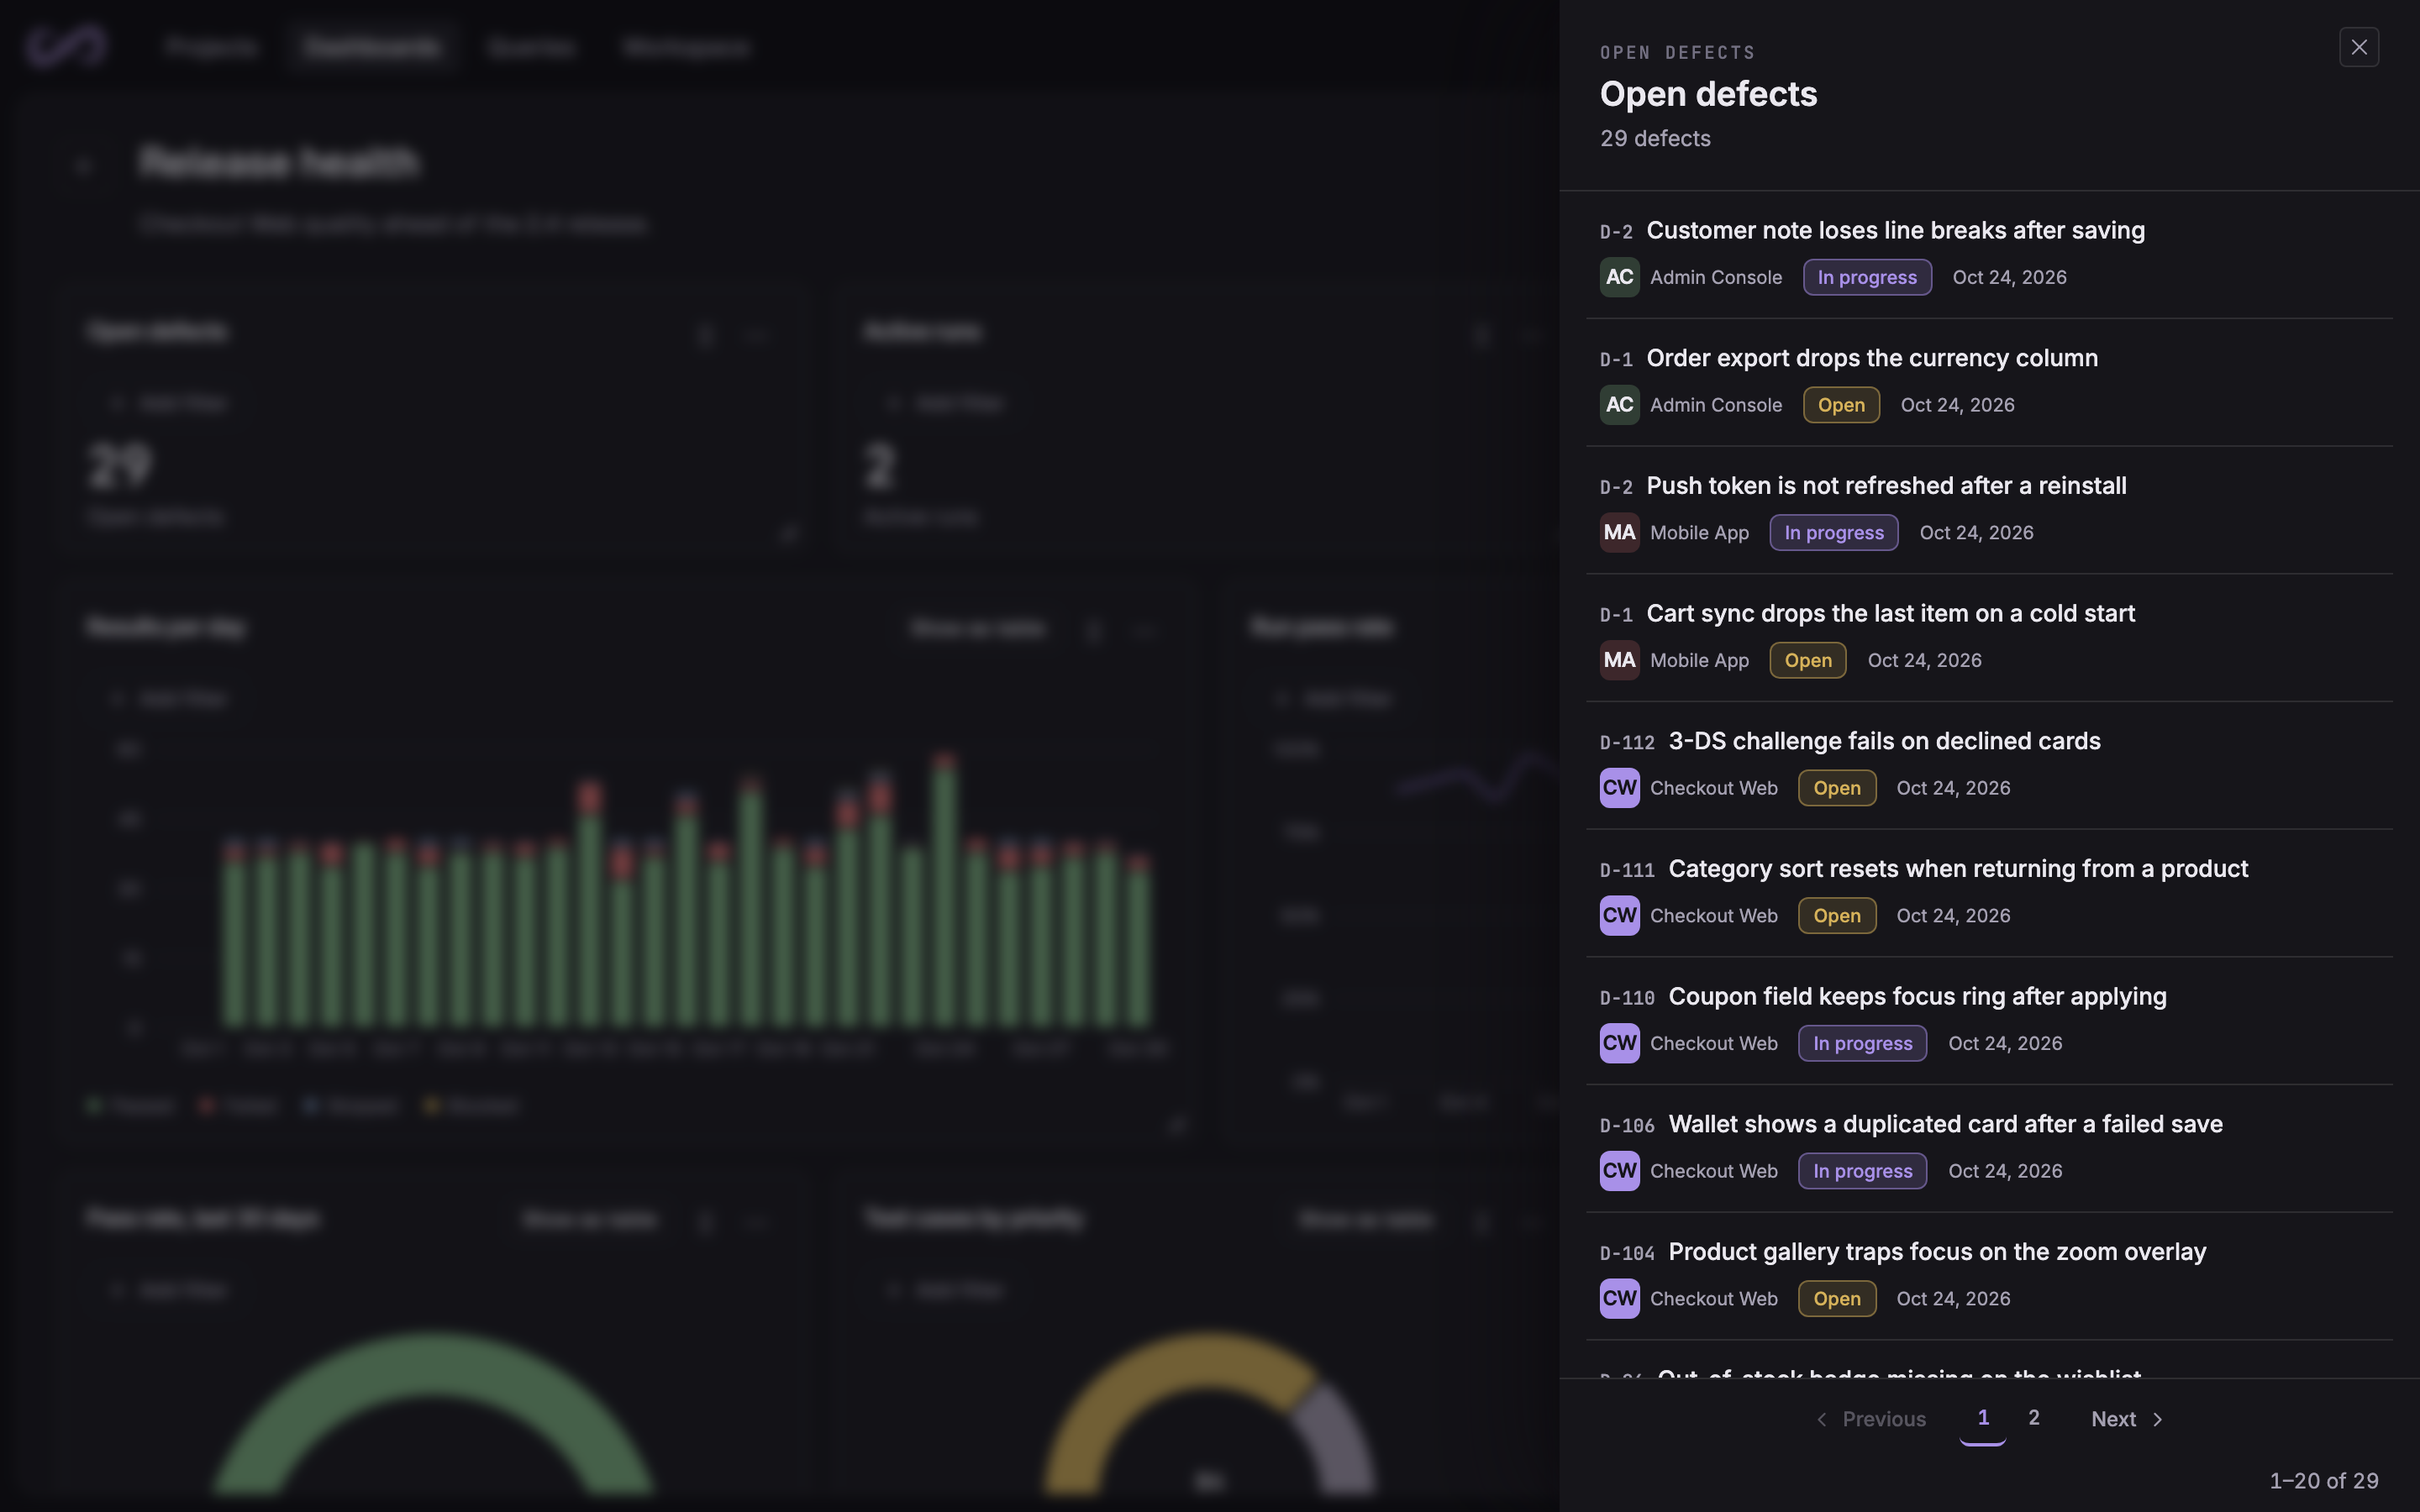
Click a value, a slice or a point and a side panel lists the test cases, defects, runs or results it counts, each one linked. Show as table gives the same numbers as a table.

Numbers are computed with the access of whoever is looking, so a widget never shows a project someone cannot open, and it says when it leaves projects out. On each project’s Defects page, a metrics strip adds open defects by severity, aging, the reopen rate and the mean time to resolve.

The records behind a dashboard value: the 29 open defects, each with its project, status and date

Share a dashboard with the people who need it

A public dashboard is visible to every member of the organization. A private one is visible to the members and user groups you pick, and every future member of a group sees it too.

Only its creator and the organization’s owners and admins can change its widgets, settings or access, and every change is recorded in the workspace activity.

Who sees a dashboard
VisibilityWho sees it
PublicEvery member of the organization
PrivateThe members and groups picked for it
EitherIts creator, owners and admins

PQL: ask your own questions of your test data

The Probara Query Language reads like the question you have in mind. Filter with WHERE, group and aggregate, look at related records with exists and count, and read the change history of a field with was and changed.

The editor suggests entities, fields, values, members and saved query names as you type, and points to each problem by its line and column.

Flaky, no pass in 30 days
FROM cases
WHERE isFlaky = true
  AND NOT exists(results where status = passed
                 AND executed > now(-30d))
Reopened in 14 days
FROM defects
WHERE status changed from resolved to open after now(-14d)
Open defects by severity
SELECT severity, count() AS n
FROM defects
WHERE status != closed
GROUP BY severity
ORDER BY n DESC

One language across cases, runs, results and defects

PQL covers nine entities, from test cases and suites to runs, results, defects, milestones and test plans. Reach from a result into its run and its case, and filter on your own custom fields by their title.

Results come back as a table or as a bar, line or donut chart, or a single value. Export them as CSV, up to 10,000 rows.

PQL entities
EntitySome of its fields
casespriority, suite, isFlaky, lastResult
runsstate, environment, milestone, passRate
resultsstatus, duration, executedBy, executed
defectsstatus, severity, assignee, resolved
milestonesstatus, start, due, completed

Save a query once, reuse it everywhere

Save a query with a name and decide who sees it, public or private. Add it to any dashboard as a live widget: when you edit the query, every widget that uses it follows.

Other queries can build on it with id in query("Name"), so a definition such as “critical failures” lives in one place.

A saved query
Visibility
Public, or private to members and groups
Dashboards
A live widget that follows every edit
Other queries
Reused with id in query("Name")
Drawn as
Table, bar, line, donut or single value

See your test results on one dashboard

Create your organization, send your first results and build your dashboard. Every new organization starts on a 14-day Pro trial, with no credit card.